Housing Permits, Starts Slide
Housing completions are up but starts and permits are down according to the US Census Bureau. Housing represents a 16.2% share of GDP.
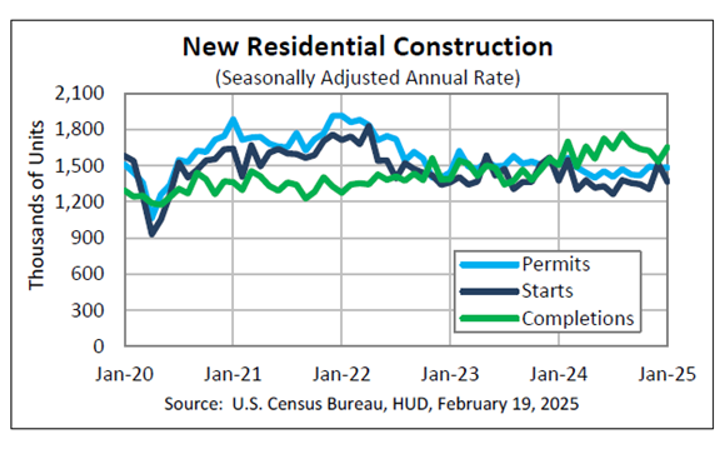
Building Permits
Privately-owned housing units authorized by building permits in January were at a seasonally adjusted annual rate of 1,483,000. This is 0.1% above the revised December rate of 1,482,000, but is 1.7% below the January 2024 rate of 1,508,000. Single-family authorizations in January were at a rate of 996,000; virtually unchanged from the revised December figure of 996,000. Authorizations of units in buildings with five units or more were at a rate of 427,000 in January.
Housing Starts
Privately-owned housing starts in January were at a seasonally adjusted annual rate of 1,366,000. This is 9.8% (±12.5%)* below the revised December estimate of 1,515,000 and is 0.7% (±13.0%)* below the January 2024 rate of 1,376,000. Single-family housing starts in January were at a rate of 993,000; this is 8.4% (±10.1%)* below the revised December figure of 1,084,000. The January rate for units in buildings with five units or more was 355,000.
Housing Completions
Privately-owned housing completions in January were at a seasonally adjusted annual rate of 1,651,000. This is 7.6% (±8.4%)* above the revised December estimate of 1,534,000 and is 9.8% (±14.0%)* above the January 2024 rate of 1,504,000. Single-family housing completions in January were at a rate of 982,000; this is 7.1% (±8.3%)* above the revised December rate of 917,000. The January rate for units in buildings with five units or more was 652,000.
* The 90 percent confidence interval includes zero. In such cases, there is insufficient statistical evidence to conclude that the actual change is different from zero.