Bearfest
April 16, 2025
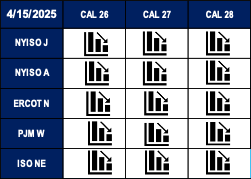
The market move down continues. Forward price curves for a sampling of calendar strips are solidly in bearish territory. This could be a good time to talk to your ENGIE representative.
This table utilizes Three Exponential Moving Averages (TEMA), a popular indicator used to analyze the direction of a trend. TEMA looks to eliminate market noise, smooth price fluctuations and eliminate lag. TEMA identifies trends (uptrend, neutral, downtrend) based on the position of the short Exponential Moving Average (EMA) versus the two longer EMAs. In this case, a 10-day EMA versus a 20-day EMA and a 50-day EMA. This table illustrates trends for RTC power calendar strip curves from 2026 through 2028, derived from proprietary data.