Forward Curves In Focus
September 08, 2025
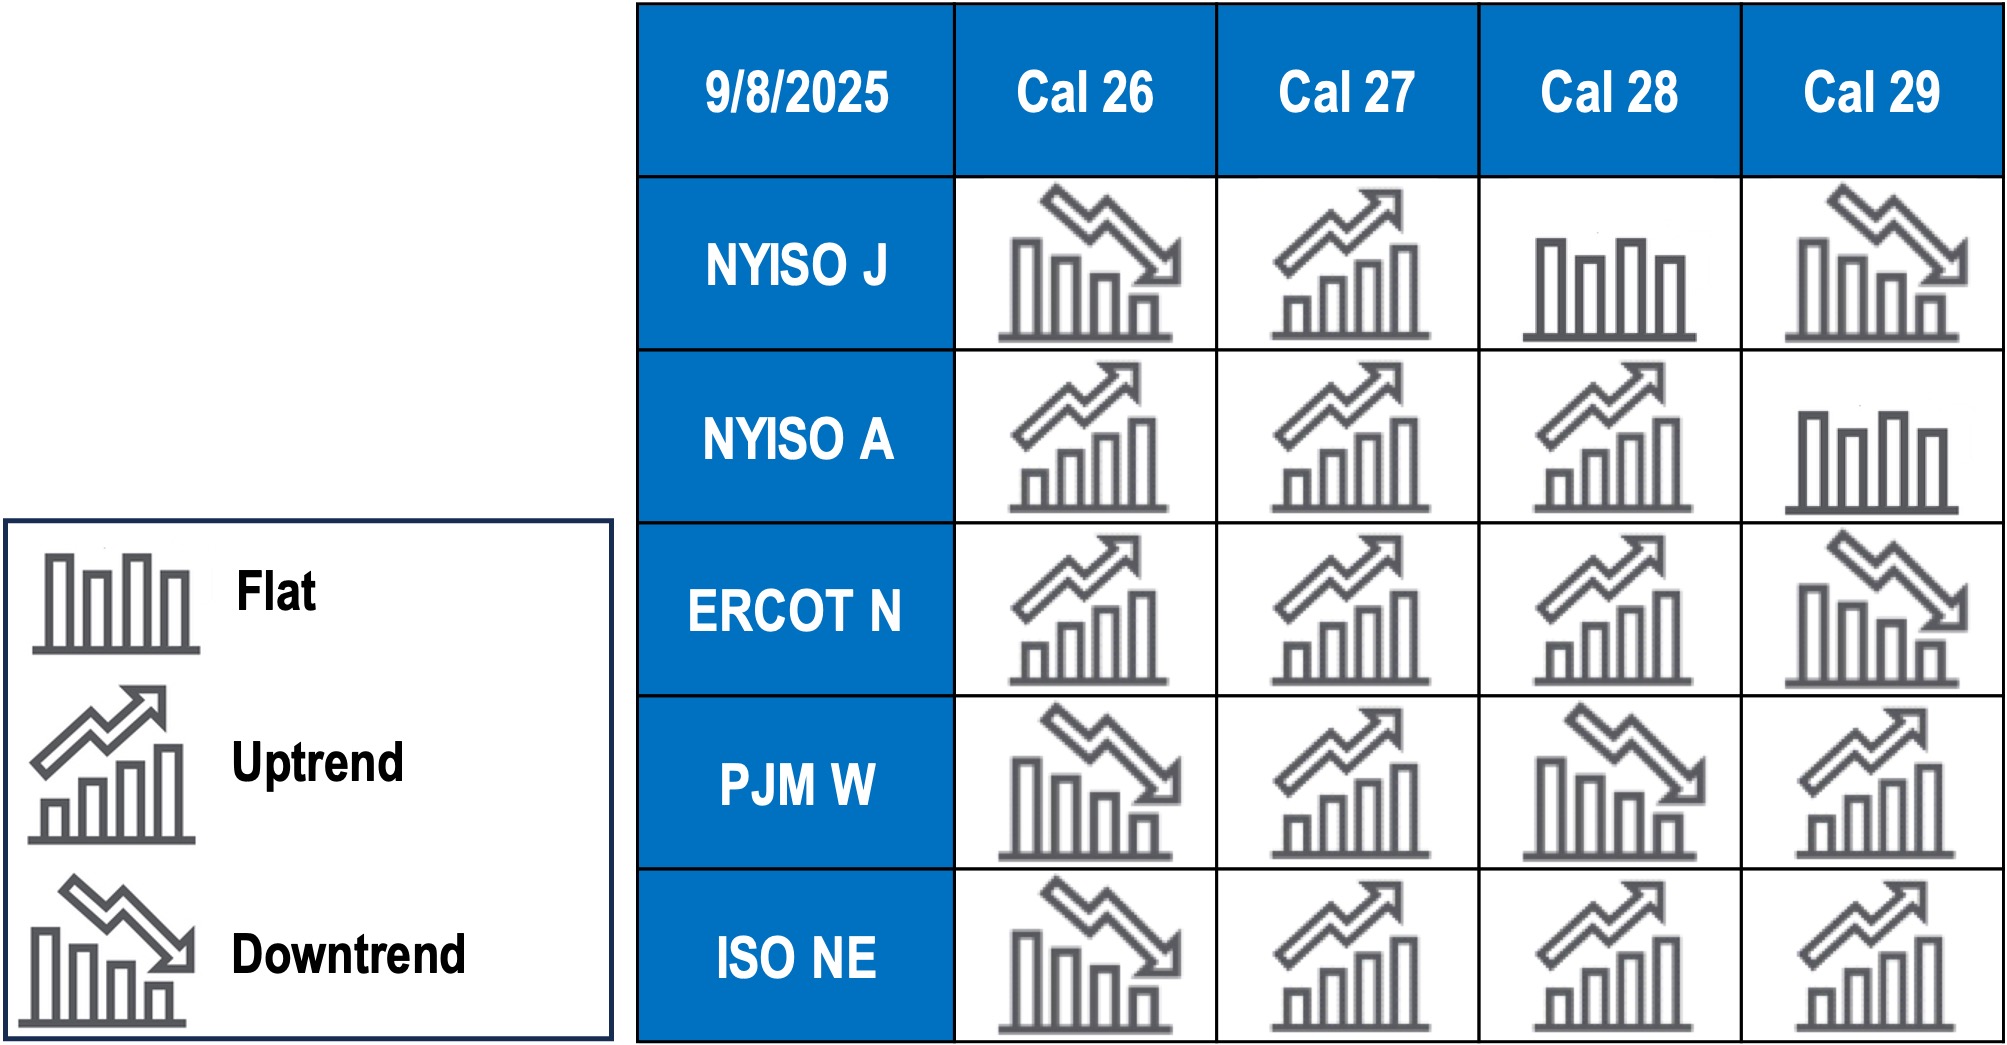
Bullish trends have emerged since our last report.
This table utilizes Three Exponential Moving Averages (TEMA) methodology for 2026-2029 RTC strips.
TEMA is a popular indicator used to analyze the direction of a trend. TEMA looks to eliminate market noise, smooth price fluctuations and eliminate lag. TEMA identifies trends (uptrend, neutral, downtrend) based on the position of the short Exponential Moving Average (EMA) versus the two longer EMAs. In this case, a 10-day EMA versus a 20-day EMA and a 50-day EMA. This table illustrates trends for RTC power calendar strip curves from 2026 through 2029, derived from proprietary data.