Blog

Get Market News

Get weekly email updates on market factors like supply, demand, and regulatory affairs. Subscribe now

Get Started with ENGIE

ENGIE Resources is ready to analyze your historical energy usage data and present appropriate options. Get started now

Become a Broker or Consultant

Complete our Brokers & Consultants Inquiry Form. Learn more

Gas Volatility Continues

February 21, 2022

Annualized Natural Gas Volatility Graph

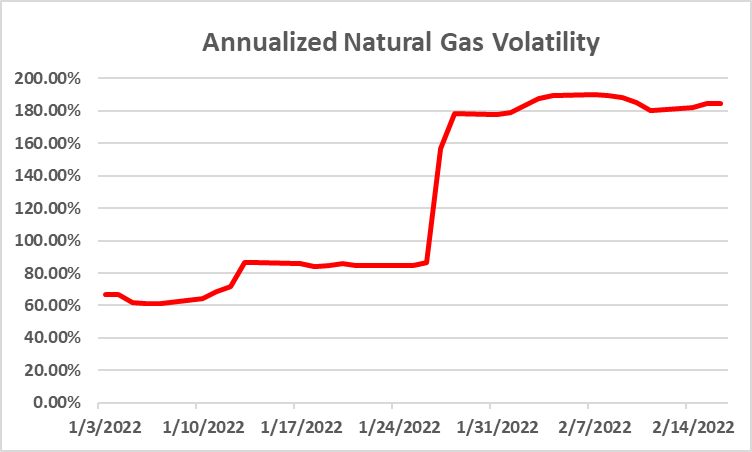
Natural gas price volatility is near record levels and the trend isn’t showing signs of dissipating. This chart shows volatility for the CME NYMEX Henry Hub benchmark starting January 1, 2022. Although the numbers are high, it has been higher. Volatility averaged 242 percent during the winter of 1995-96. EIA lists a number of factors that contribute to volatility.

  • Weather
  • Production/Imports
  • Storage
  • Delivery Constraints
  • Market Information

For more:
https://www.eia.gov/naturalgas/weekly/archivenew_ngwu/2003/10_23/Volatility%2010-22-03.htm#:~:text=Prices%20of%20basic%20energy%20(natural,natural%20gas%20for%20example%2C%20fluctuates.