Mystery Chart
September 29, 2025
Can you identify a market from its curve? If yes, what chart is this?
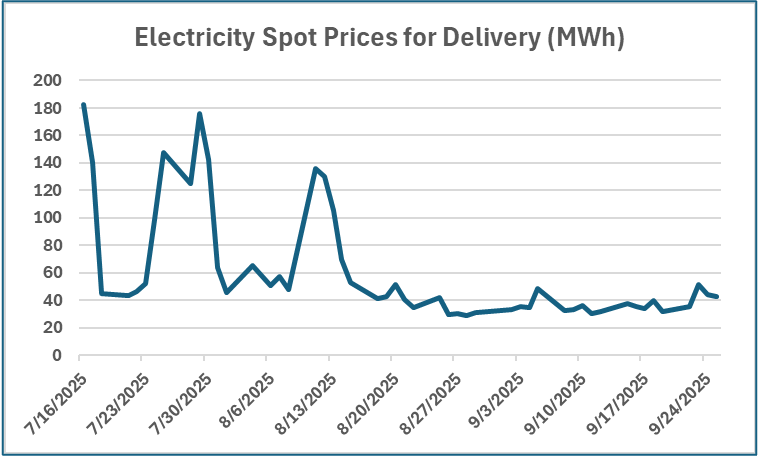
This plot represents electricity spot prices for delivery (MWh) according to EIA data. The daily price action from July to the present is the most volatile of the four choices, but two other markets are not far off. The average from mid July is $61.33/MWh. The low was $28.29/MWh and the high was $183.23/MWh. It does not own the distinction of having the highest natural gas prices for spot delivery over this timeline. It takes second place by a margin of 29 cents per mmbtu. Do you know it?
A: New York City
B: Houston
C: Midwest
D: New England