Whose Curves are These?
November 20, 2023
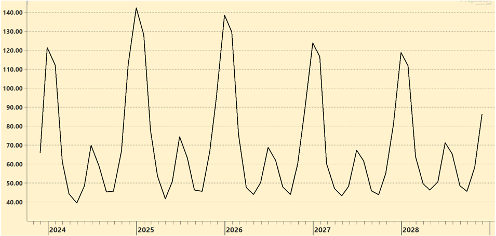
Graph A
Graph B
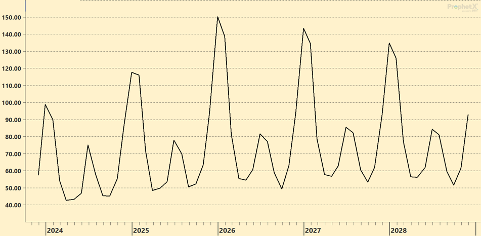
Can you spot the market based on a forward curve?
Give it a go – check out these images of two day-ahead peak curves. They illustrate the unique characteristics in competitive retail power markets – can you guess the two distinct regions they represent?
Scroll down a bit for the answer. Your ENGIE Resources representative can help you decipher whether these trends are your friends.
Data Source: DTN ProphetX (11/15/23)
Answers A: ISO NE B: NYISO Zn J